Obstacle Avoidance and Path Planning
Fall 2015, Course Project, Mobile Robotics
Assumptions:
- The problem assumes the radius of the robot as 0.5 units.
- The obstacles are only rectangular in shape.
- The area is limited to 15 x 15 units (for visualization purposes).
Reading the Plot:
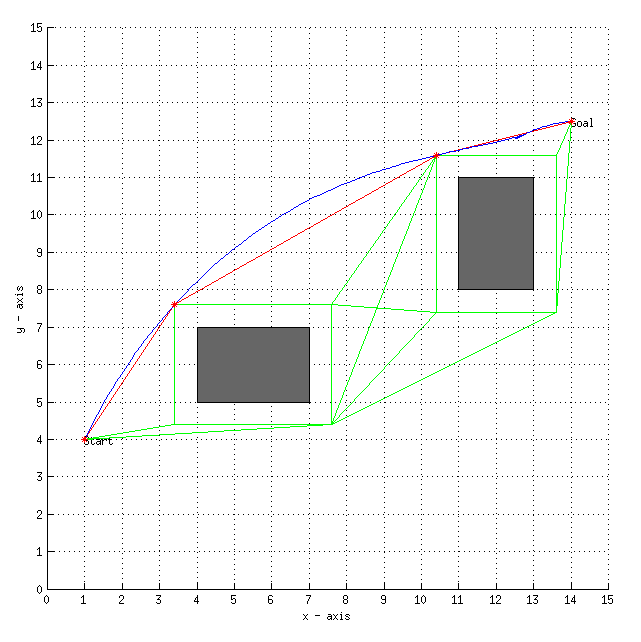
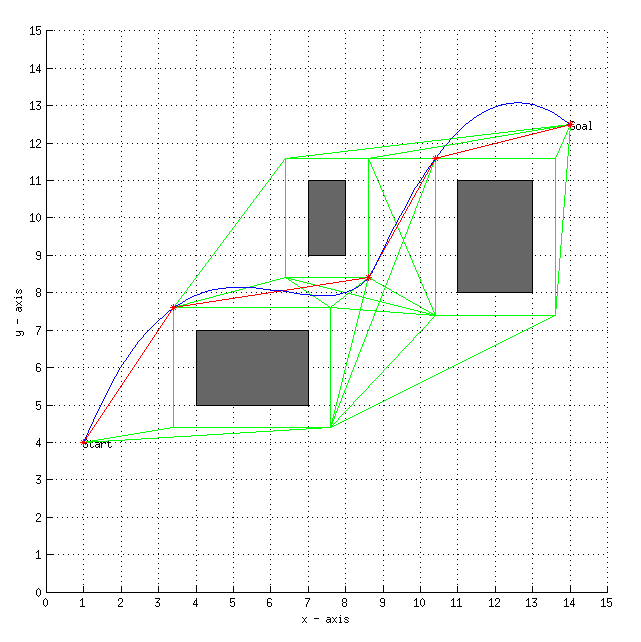
- The solid filled rectangles represent the obstacles.
- The dotted lines around the obstacles represent the offset for the robot.
- The green lines represent edges of the visibility graph that were not finally selected.
- The red lines represent edges constituting the shortest path from start to goal.
- The start and goal points have been exclusively mentioned on the plot.
- The blue curve is the final path the robot will undertake.
- The points marked with ‘*’ are the intermediate points.
Approach:
- Initialization of start, goal, obstacles, offsets.
- Constructing an adjacency matrix
- Revising the adjacency matrix based on intersection with obstacle.
- Feeding the adjacency matrix to dijkstra(), implemented as a separate function.
- The output of dijkstra() is used to compute the Bernstein curve, as done in the last part of the project.
- The code is now generalized for maximum 3 intermediate points, order has been set constant at 5.
- The graph is plotted in sequence, and can be visualized as an animation.
Graphs related to 2 testcases are shown.

